IEE 475: Lecture C2 (2026-09-15): Beyond DES Simulation – SDM, ABM, and NetLogo
 Watch on YouTube →
Overview
Ted Pavlic contrasts discrete-event system simulation (DES) with system dynamics modeling (SDM) and agent-based modeling (ABM), emphasizing that the right method depends on whether the question concerns detailed process timing, long-run average trends, or how individual agents and spatial interactions shape outcomes. He illustrates the trade-offs with an SIR disease model, NetLogo predator–prey simulations, airline cargo and boarding examples, and Monte Carlo lab exercises on estimating π, confidence intervals, stochastic activity networks, and random-variable generation.
Key takeaways
- Use DES for detailed event timing and process flows, SDM for deterministic average trends over long horizons, and ABM when individual behavior or spatial interactions drive the question.
- An SDM stock is a continuous-valued quantity changed by flows; an SIR model uses this structure to describe average movement from susceptible to infectious to recovered populations.
- ABM makes spatial hypotheses testable, but choices such as movement rules, agent behavior, and NetLogo’s wraparound world boundary add assumptions that must be examined.
- Southwest’s cargo simulation found that sending a package on any available flight could beat waiting for one headed in the right direction, because a hub can provide a later connection.
- Monte Carlo estimates become more precise as sample size increases, while confidence intervals make the remaining uncertainty explicit and help determine how many replications an analysis needs.
- Taking the maximum of parallel stochastic paths can raise expected completion time above every path’s individual mean; path distributions help explain why the critical path is not selected equally often.
Chapters
0:00
Course Logistics: NetLogo Lab, Arena Access, and Upcoming Homework
- Lab 4 introduces NetLogo; Lab 5 begins the shift to Arena as the course’s main DES platform.
- Arena is available through remote access, Windows installations, and the M111 lab machines.
- Homework C2 covers random-number generation and is due the Saturday after Lecture D2; the midterm follows Lectures E2 and a review.
4:24
DES Applications and Choosing the Right Simulation Scale
- DES is used across manufacturing, healthcare, logistics, transportation, military operations, and services—not only in Arena but also in tools such as FlexSim and Simio.
- The course’s DES models aim for an illustrative level of detail: enough to answer operational questions without an excessive modeling burden.
- A baseball-statistics project is better served by analyzing existing game data than by simulating every detail of baseball when the goal is to test predictions against observed outcomes.
9:00
System Dynamics Models Capture Long-Run Average Trends
- SDM is suited to strategic scenario analysis when the goal is to understand broad trends rather than minute-by-minute system behavior.
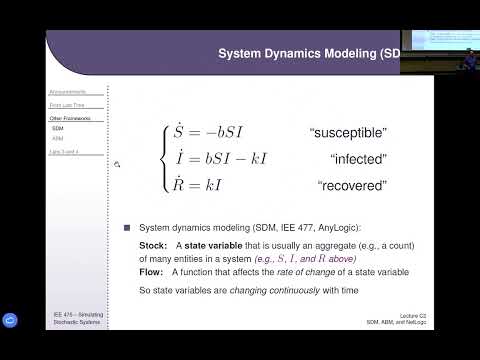
- In an SIR disease model, susceptible, infectious, and recovered populations are represented as average-valued stocks rather than individually tracked people.
- The SIR example models infection as depending on interactions between susceptible and infectious populations, and recovery as a flow out of the infectious population.
16:20
Stocks, Flows, and Deterministic Differential Equations
- SDM represents a system as stocks connected by flows, much like quantities of water moving between buckets.
- Flow equations describe how stocks change; software numerically integrates the resulting differential equations from an initial condition.
- A mean-field SDM run produces a deterministic average trajectory, unlike a stochastic DES model that requires repeated replications to represent randomness.
20:20
Vensim Diagrams Reveal Feedback Loops and Trends
- Vensim and AnyLogic let modelers draw stocks, flows, and causal links instead of writing differential equations directly.
- Causal arrows can expose positive and negative feedback loops, helping analysts anticipate whether a system may rise, level off, or oscillate.
- Parameter sliders for factors such as infection rate let users compare how average susceptible, infectious, and recovered trajectories change.
23:16
ABM Adds Individual Decisions and Spatial Interaction
- In DES, process logic constrains entities to known routes and event timings; in ABM, behavior is placed in agents that follow local rules and may move through a space.
- ABM is especially useful when the spatial arrangement itself is unknown or important, rather than already captured as travel time between DES processes.
- The NetLogo predator–prey example tracks wolves, sheep, and grass patches, so sheep can be affected by both predators and local food availability.
27:40
ABM Flexibility Comes with Greater Modeling Burden
- A spatial ABM can produce irregular population patterns as agents move, eat, and interact; those variations are central to the analysis rather than averaged away.
- Choices such as NetLogo’s wraparound, torus-like world boundary are assumptions that can affect results and must be justified.
- ABM is strongest for testing a stated hypothesis—for example, whether resource limits stabilize predator–prey cycles—because its many behavioral details also create more opportunities for model error.
31:39
ABM Across Biology, Social Science, Engineering, and GIS
- Biologists often call these individual-based models (IBMs), while social scientists commonly use agent-based models (ABMs); engineering applications often use the term multi-agent systems (MAS).
- NetLogo adapts the accessible Logo programming approach to multiple communicating agents; Repast and Repast HPC support larger models, including millions of agents.
- GIS-linked ABMs place agents on real maps and terrain; GAMA supports continuous space, while Mesa provides a Python ABM framework and AnyLogic combines ABM, SDM, and DES.
39:09
Zombie-Building Simulations Turn Spatial Behavior into a Design Test
- LMI’s student competition used a building map populated by human agents and zombies; teams designed human behaviors to improve survival.
- The exercise demonstrated how agent rules and building layouts can be tested together in a spatial model.
- A related architecture application used ABM to compare building designs for their potential to provide refuge during an attack.
44:46
Southwest Airlines Uses ABM for Cargo and Boarding Decisions
- A Southwest cargo model compared loading packages only onto flights headed roughly toward their destination with loading them onto any available flight when no suitable route existed.
- The model found that getting a package onto any flight could reduce delivery time: the package might reach a hub sooner and then connect to its destination.
- Boarding simulations found that boarding-order strategies had little effect on on-time departures, in part because passenger behavior disrupts the assigned order; airlines could instead monetize preferred boarding positions.
51:26
System Dynamics Check-In and the Monte Carlo Lab Recap
- A clicker question checks the SDM term for a state quantity paired with flows: a stock, analogous to inventory.
- Lab 3’s Monte Carlo exercise estimates π by sampling points in a unit square and checking whether x² + y² ≤ 1.
- The fraction of sampled points inside the quarter-circle estimates π/4; multiplying that fraction by four gives an estimate of π.
54:02
Monte Carlo Confidence Intervals and Uniform Random Inputs
- A 95% confidence interval from the π experiment is expected to miss the true value in about 5% of repeated experiments.
- Increasing the sample size narrows the interval, but more samples also require more computation; replication counts should reflect the precision an application needs.
- Excel’s RAND function generates values between zero and one, which can be transformed into other random variables.
1:00:56
Stochastic Activity Networks, Critical Paths, and the CLT
- In the lab’s parallel-path network, three, two, and one random activity durations are summed along their respective paths, and the project waits for the maximum.
- Although each path has an average duration of nine, taking the maximum produces an average above nine; the one-activity path is selected as critical most often.
- The Central Limit Theorem explains why sums of uniform durations begin to look bell-shaped, while a single uniform duration retains its flat shape and is more likely to generate extreme maxima.
1:07:15
Transform Uniform Draws into Discrete and Continuous Distributions
- A uniform draw can be scaled to a new range using the lower bound plus the range width multiplied by the draw.
- For discrete outcomes with probabilities 20%, 50%, and 30%, cumulative cutoffs at 0.2 and 0.7 map one uniform draw to an outcome.
- The inverse cumulative distribution function transforms uniform inputs into samples from distributions such as the Erlang; deriving and using these inverse formulas is part of the preparation for the midterm.
Summary, takeaways, and chapters were generated by AI from the video's transcript and may contain errors. The video belongs to its creator, Ted Pavlic.