How to Graph Basic Polar Equations (Precalculus - Trigonometry 41)
 Watch on YouTube →
Overview
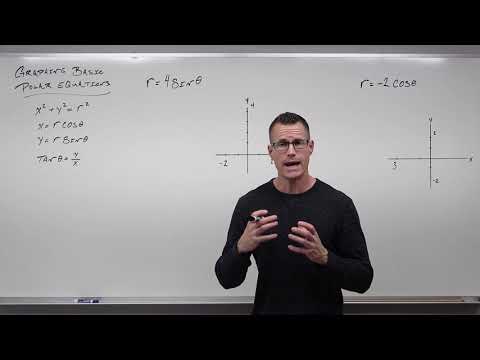
Professor Leonard demonstrates how to graph basic polar equations by converting them into rectangular coordinates, utilizing key identities like x² + y² = r², r cos θ = x, and r sin θ = y. He illustrates that constant r values yield circles centered at the pole, constant θ values produce diagonal lines through the pole, and equations involving r sin θ or r cos θ can be transformed into horizontal or vertical lines, respectively. More complex equations like r = 4 sin θ or r = -2 cos θ are shown to represent shifted circles, requiring completing the square to identify their centers and radii.
Key takeaways
- Polar equations with a constant radius (e.g., r = 3) graph as circles centered at the pole (origin).
- Polar equations with a constant angle (e.g., θ = π/4) graph as lines passing through the pole.
- Polar equations of the form r = a sin θ or r = a cos θ translate to circles that are shifted from the origin.
- To graph r = a sin θ or r = a cos θ, multiply by r, substitute polar-to-rectangular identities, and complete the square to find the center and radius of the resulting circle.
- Equations like r sin θ = c or r cos θ = c translate directly to horizontal (y = c) or vertical (x = c) lines, respectively.
Chapters
- Goal: Graph basic polar equations by transforming them into familiar rectangular forms.
- Key polar-to-rectangular identities: x² + y² = r², r cos θ = x, r sin θ = y, tan θ = y/x.
- This method aids in visualizing simple polar equations like r = 3 or θ = π/4.
- Future videos will cover graphing advanced polar equations using symmetry.
- r = 3 transforms to r² = 9, then x² + y² = 9, representing a circle centered at the origin with radius 3.
- θ = π/4 transforms to tan(θ) = tan(π/4), then y/x = 1, resulting in y = x, a diagonal line through the origin.
- r sin θ = 2 transforms to y = 2, a horizontal line.
- r cos θ = -3 transforms to x = -3, a vertical line.
- Multiply r = 4 sin θ by r to get r² = 4r sin θ.
- Substitute r² = x² + y² and r sin θ = y to get x² + y² = 4y.
- Rearrange to x² + y² - 4y = 0 and complete the square for y: x² + (y - 2)² = 4.
- This represents a circle centered at (0, 2) with a radius of 2.
Summary, takeaways, and chapters were generated by AI from the video's transcript and may contain errors. The video belongs to its creator, Professor Leonard.