How to Graph Advanced Polar Equations with Symmetry (Precalculus - Trigonometry 42)
 Watch on YouTube →
Overview
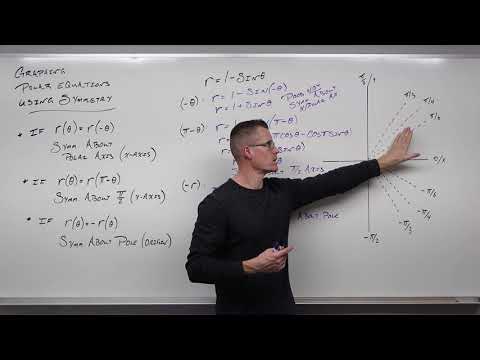
Professor Leonard demonstrates how to graph advanced polar equations by leveraging symmetry, as converting them to rectangular form is often impractical. He outlines three types of symmetry (polar axis, pi/2 axis, and pole) and shows how to test for them by substituting specific angle or r values. By identifying symmetry, the number of points needed for graphing is significantly reduced, making the process more efficient.
Key takeaways
- Testing for symmetry (polar axis, pi/2 axis, pole) is crucial for efficiently graphing polar equations.
- Symmetry about the polar axis occurs when replacing theta with -theta yields the same equation.
- Symmetry about the pi/2 axis occurs when replacing theta with pi - theta yields the same equation.
- Symmetry about the pole occurs when replacing r with -r yields the same equation.
- If a polar equation has symmetry about both the polar axis and the pi/2 axis, it also has symmetry about the pole.
- For r^2 = f(theta), the condition r^2 >= 0 limits the domain of theta where the graph exists.
Chapters
0:00
Introduction to Polar Equations and the Need for Symmetry
- Many polar equations are difficult or impossible to convert into simple rectangular forms.
- Symmetry analysis allows for efficient graphing by plotting fewer points.
- Three main types of symmetry are discussed: polar axis, pi/2 axis, and the pole.
1:51
Testing for Symmetry in Polar Equations
- Symmetry about the polar axis (x-axis): Replace theta with -theta; equation remains unchanged.
- Symmetry about the pi/2 axis (y-axis): Replace theta with pi - theta; equation remains unchanged.
- Symmetry about the pole (origin): Replace r with -r; equation remains unchanged.
5:48
Example 1: Graphing r = 1 - sin(theta) (Cardioid)
- Testing for polar axis symmetry: 1 - sin(-theta) = 1 + sin(theta), which is not the original equation.
- Testing for pi/2 axis symmetry: 1 - sin(pi - theta) = 1 - sin(theta), confirming symmetry about the y-axis.
- Testing for pole symmetry: -r = 1 - sin(theta), which is not the original equation.
- Plotting points from -pi/2 to pi/2 and using y-axis symmetry to complete the cardioid graph.
18:10
Calculating Points for r = 1 - sin(theta)
- Key angles and their corresponding r values: (-pi/2, 2), (-pi/3, 1.87), (-pi/4, 1.71), (-pi/6, 1.5), (0, 1), (pi/6, 0.5), (pi/4, 0.29), (pi/3, 0.13), (pi/2, 0).
17:10
Applying Symmetry to Graph r = 1 - sin(theta)
- Only symmetry about the y-axis was confirmed.
- Points from -pi/2 to pi/2 are plotted.
- The graph is completed by mirroring the plotted points across the y-axis to form a cardioid.
36:57
Calculating Points for r = 1 + 2cos(theta)
- Key angles and their corresponding r values: (0, 3), (pi/6, 2.73), (pi/4, 2.41), (pi/3, 2), (pi/2, 1), (2pi/3, 0), (3pi/4, -0.41), (5pi/6, -0.73), (pi, -1).
45:41
Example 3: Graphing r = 2cos(2*theta) (Rose Curve)
- Symmetry about polar axis: 2cos(-2*theta) = 2cos(2*theta), confirmed.
- Symmetry about pi/2 axis: 2cos(2(pi - theta)) = 2cos(2pi - 2*theta) = 2cos(-2*theta) = 2cos(2*theta), confirmed.
- Due to symmetry about both axes, symmetry about the pole is also confirmed.
- Only need to plot points in the first quadrant (0 to pi/2) and use symmetry.
Summary, takeaways, and chapters were generated by AI from the video's transcript and may contain errors. The video belongs to its creator, Professor Leonard.