Has Inequality Ever Been Worse?
 Watch on YouTube →
Overview
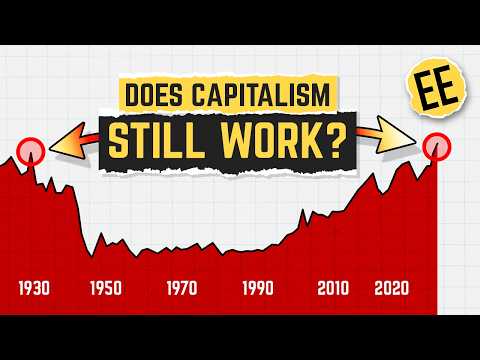
Economics Explained highlights the deep disagreement among economists regarding whether global inequality has worsened or improved, presenting data for both sides. The argument for worsening inequality, supported by Emmanuel Saez and Gabriel Zucman, points to stagnant real wages and the 'R > G' phenomenon (returns on capital outpacing economic growth), while the counter-argument, referencing OECD data and consumption metrics, suggests a decline from historical Gilded Age levels and improved material well-being for most.
Key takeaways
- The top 0.1% of US households now hold approximately 20% of the nation's wealth, up from 7% in the late 1970s.
- Thomas Piketty's 'R > G' theory posits that when the rate of return on capital (R) exceeds economic growth (G), wealth concentrates.
- While income and wealth inequality metrics show concerning trends, consumption inequality has risen much less dramatically, suggesting improved material well-being for many.
- Global extreme poverty has been significantly reduced, with the rate dropping from 36% in 1990 to under 10% by 2025.
- Disagreements among economists on inequality stem from differing methodological choices in data analysis, time period selection, and measurement focus (income vs. wealth vs. consumption).
- Human psychological biases like loss aversion and nostalgia for the past can skew perceptions of economic trends.
Chapters
0:00
The Dichotomy of Inequality: Worsening vs. Improving
- The top 11 individuals control more wealth than the bottom half of humanity.
- Average household incomes are stagnant in developed economies, while top 1% incomes have doubled or tripled.
- Economists disagree fundamentally on whether inequality has increased or decreased.
- The debate hinges on data interpretation, timeframes, and measurement methods (income vs. wealth vs. consumption).
5:10
Evidence for Worsening Inequality: Stagnant Wages and 'R > G'
- Saez and Zucman's research shows the top 0.1% of US households tripled their wealth share since the late 1970s.
- Thomas Piketty's 'R > G' (return on capital > economic growth) explains how asset owners outpace overall economic growth.
- Real hourly wages for US workers peaked in 1973 and have lagged productivity growth significantly.
- Union membership has declined from 35% in 1954 to ~10% today, reducing worker bargaining power.
13:48
Counter-Arguments: Consumption, Historical Context, and Global Poverty Reduction
- OECD data suggests wealth inequality has fallen from early 20th-century Gilded Age levels.
- Consumption inequality has risen far less than income inequality (7% vs. 26% since 1960s).
- Matthew Rognlie's critique highlights that accounting for capital depreciation alters the picture, with real estate being the main growing asset class.
- Global extreme poverty has seen the greatest reduction in history, falling from 36% to under 10% since 1990.
Summary, takeaways, and chapters were generated by AI from the video's transcript and may contain errors. The video belongs to its creator, Economics Explained.