Graphing polar functions | AP®︎/College Precalculus | Khan Academy
 Watch on YouTube →
Overview
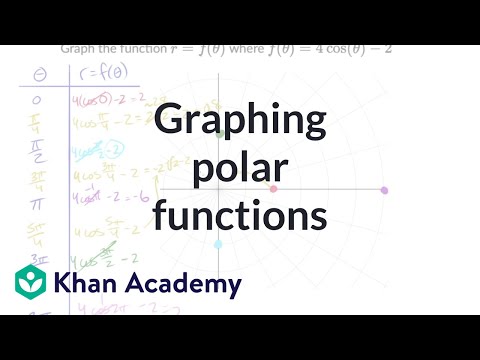
Khan Academy demonstrates how to graph the polar function r = 4 cos(theta) - 2 by creating a table of theta and r values at key angles (0, pi/2, pi, 3pi/2, 2pi) and intermediate angles (pi/4, 3pi/4, 5pi/4). The process involves calculating r for each theta, plotting points, and connecting them sequentially, highlighting how negative r values result in plotting in the opposite direction. The explanation emphasizes the importance of evaluating trigonometric functions and approximating decimal values for sketching the curve, which resembles a limaçon.
Key takeaways
- To graph polar functions, create a table of (theta, r) values, evaluating r = 4 cos(theta) - 2 at key angles like 0, pi/2, pi, 3pi/2, and 2pi.
- Negative values of r require plotting points in the direction opposite to the angle theta.
- Intermediate angles such as pi/4, 3pi/4, and 5pi/4 provide more detail for accurately sketching the polar curve.
- The function r = 4 cos(theta) - 2 generates a limaçon graph, characterized by its shape and a 'dimple' when the constant term is less than twice the coefficient of the cosine term.
- Approximating decimal values for r (e.g., 2*sqrt(2) - 2 ≈ 0.8, -2*sqrt(2) - 2 ≈ -4.8) aids in precise plotting.
- Connecting the plotted points in order of increasing theta reveals the continuous path of the polar function.
Chapters
0:00
Establishing Key Points for r = 4 cos(theta) - 2
- Calculated r values for theta = 0, pi/2, pi, 3pi/2, and 2pi.
- At theta=0, r=2; at theta=pi/2, r=-2; at theta=pi, r=-6; at theta=3pi/2, r=-2; at theta=2pi, r=2.
- Plotted these points, noting negative r values mean plotting in the opposite direction of theta.
- Identified points at (2,0), (-2, pi/2) -> (2, 3pi/2), (-6, pi), (-2, 3pi/2) -> (2, pi/2).
6:38
Calculating Intermediate Points and Approximating Values
- Evaluated r for theta = pi/4, 3pi/4, and 5pi/4.
- For theta=pi/4, r = 2*sqrt(2) - 2 ≈ 0.8.
- For theta=3pi/4, r = -2*sqrt(2) - 2 ≈ -4.8.
- For theta=5pi/4, r = -2*sqrt(2) - 2 ≈ -4.8.
Summary, takeaways, and chapters were generated by AI from the video's transcript and may contain errors. The video belongs to its creator, Khan Academy.