False Discovery Rates, FDR, clearly explained
 Watch on YouTube →
Overview
StatQuest with Josh Starmer explains False Discovery Rates (FDR) as a method to control the proportion of false positives in high-throughput sequencing and other statistical tests. The Benjamini-Hochberg procedure is detailed as a practical approach to adjust P-values, ensuring that a specified percentage (e.g., 5%) of significant results are indeed true discoveries, thereby weeding out "bad data that looks good."
Key takeaways
- In high-throughput experiments with many tests, a standard 0.05 P-value threshold can lead to a large number of false positives (e.g., 500 out of 10,000 tests).
- False Discovery Rate (FDR) aims to control the *proportion* of false positives among the declared significant results, not the total number of false positives.
- The Benjamini-Hochberg procedure is a common method to calculate FDR-adjusted P-values, making them larger and thus more conservative.
- When P-values are uniformly distributed (samples from the same distribution), approximately 5% will be less than 0.05.
- When P-values are skewed towards zero (samples from different distributions), more P-values will fall below 0.05.
- The Benjamini-Hochberg method adjusts P-values by comparing them to a threshold that depends on their rank and the total number of tests, ensuring that at most 5% of the significant findings are false discoveries.
Chapters
0:00
Introduction to False Discovery Rates (FDR)
- FDR is a tool to identify and discard "bad data that looks good," particularly relevant in high-throughput sequencing.
- A single statistical test with a P-value cutoff of 0.05 has a 5% chance of a false positive.
- When performing 10,000 tests, this 5% false positive rate leads to 500 false positives.
9:05
Understanding P-Value Distributions
- When samples come from the same distribution (e.g., control mice), P-values are uniformly distributed.
- When samples come from different distributions (e.g., control vs. drug-treated mice), P-values are skewed towards zero.
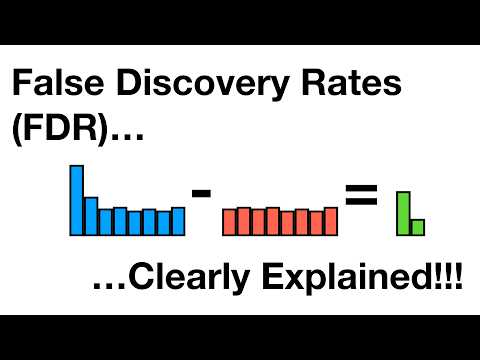
- The combined histogram of P-values from both scenarios shows a uniform distribution for unaffected genes and a skewed distribution for affected genes.
Summary, takeaways, and chapters were generated by AI from the video's transcript and may contain errors. The video belongs to its creator, StatQuest with Josh Starmer.