EDF9850_Example4b
 Watch on YouTube →
Overview
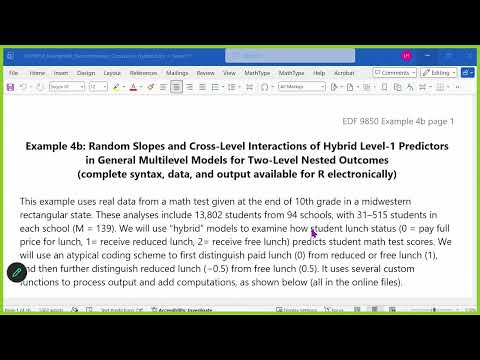
Lesa Hoffman builds a multilevel model of 10th-grade math scores for more than 13,000 students in 94 Midwestern schools, using paid, reduced-price, and free lunch status to demonstrate contrast coding, contextual effects, random slopes, and cross-level interactions. The analysis shows that school lunch composition explains much of the between-school math variation, while the student-level lunch gap varies across schools and becomes weaker as a school’s share of students receiving discounted lunch rises.
Key takeaways
- In the empty math model, the school ICC is 0.15 and the design effect is about 22, so 13,000 clustered student records provide roughly the independent information of 600 unclustered observations.
- A student-level lunch predictor can appear to explain school-level math variance when its within-school and between-school associations are combined; adding school composition predictors separates contextual effects from student contrasts.
- The model explains about 70% of between-school variance but only 6% of within-school variance; together, student lunch status and school lunch composition account for about 17% of total math-score variance.
- Random slopes show that the paid-versus-discounted math gap varies across schools, averaging about 7.7 points and ranging from nearly zero to about 14 points, while the reduced-versus-free slope does not vary significantly.
- With constant-centered predictors, a cross-level interaction can mix within-school and between-school moderation; adding the corresponding school-mean interaction—and a quadratic when the moderator is that same mean—separates the effects.
- The discounted-lunch student gap is about 8 points at the reference school composition and becomes weaker as the share of discounted-lunch students rises; school composition does not significantly moderate the reduced-versus-free difference.
Chapters
0:00
Course Updates, Homework 3, and Presentation Planning
- Homework 2 grades and feedback are available; Homework 3, based on Example 4B, is due in two weeks.
- Lesa Hoffman plans to update the functions file to support models with more than two levels and will post Lecture 5 materials for the following week.
- Presentation check-in documents, grading rubrics, peer-review materials, and the proposed presentation schedule are posted; presentations will take place on recorded Zoom sessions hosted privately in Canvas.
5:51
Example 4B Data and Its Lunch-Status Research Question
- The example uses real, non-shareable data on more than 13,000 students in 94 schools who took a 10th-grade math test in a Midwestern state.
- Schools with fewer than 30 students were excluded; the student-level predictor is ordinal lunch status: paid, reduced-price, or free.
- The example uses constant centering to demonstrate a widely used modeling approach, though Hoffman says students may use cluster-mean centering for their own projects.
9:46
Contrasts for Paid, Reduced-Price, and Free Lunch
- Hoffman codes paid versus discounted lunch as 0 versus 1, then codes reduced versus free as −0.5 versus +0.5 while keeping paid at zero.
- The first contrast compares paid students with the equally weighted average of reduced-price and free-lunch students; the second separates reduced from free.
- With four categories, three contrasts are needed to distinguish all four means; ordinary indicator coding is common in R but can make dropping individual contrasts harder to interpret.
12:10
Ordinal Coding, Reference Values, and School Lunch Composition
- Sequential coding can represent changes between successive levels of an ordered predictor, while indicator coding is a typical option for unordered categories.
- Hoffman creates binary indicators for paid, reduced-price, and free lunch so she can calculate each school’s proportion in each group.
- The reference school is set to approximately 70% paid, 10% reduced-price, and 20% free lunch; centering school composition at these values makes model intercepts interpretable.
18:16
Student-Level and School-Level Lunch–Math Correlations
- Across schools, mean math scores range from about 30 to 61, and the average lunch composition is roughly 70% paid, 10% reduced-price, and 20% free.
- The raw student-level correlation between discounted lunch and math combines within-school and between-school relationships rather than isolating either one.
- Separating the levels reveals a smaller student-level association and a much larger school-level association between discounted-lunch prevalence and math scores.
23:23
Empty Math Model: ICC, Design Effect, and School Differences
- The empty multilevel model estimates a math-score intraclass correlation (ICC) of 0.15, meaning 15% of variance is attributable to differences between school means.
- With the large average school size, the design effect is about 22, reducing the roughly 13,000 students’ effective independent information to about 600.
- The estimated school means average about 48 and vary approximately from 35 to 61 across 95% of schools; the cluster means are reliable because each school has many students.
28:04
Ordinal Mixed Models for Lunch Status Across Schools
- Hoffman uses R’s ordinal package and its clmm function to fit a cumulative-logit mixed model with lunch status as the outcome.
- The model estimates substantial school-level variation in lunch composition; the logistic latent-scale residual variance is conventionally π²/3, approximately 3.29.
- The estimated ordinal-model ICC is about 0.35, indicating significant school differences in lunch-status composition that should be considered alongside school variation in math.
32:50
Student Lunch Effects and the Problem of Smooshing
- A fixed-effects model includes paid-versus-discounted and reduced-versus-free contrasts, initially assuming their effects are identical across schools.
- Students receiving discounted lunch score about 8.5 points lower on average in the initial model, and the reduced-versus-free contrast further distinguishes the groups.
- The student predictors appear to explain about 6% of student-level math variance but also about 38% of school-level variance—a warning that within- and between-school effects have been smooshed together.
37:27
Contextual Effects and the School-Level Share of Explained Variance
- Adding centered school-level proportions separates contextual effects from student-level lunch-status effects; the reference school has 70% paid, 10% reduced-price, and 20% free-lunch students.
- For each 10-percentage-point increase in a school’s discounted-lunch share, predicted school mean math falls by about 1.8 points; the school-level reduced-versus-free contrast is not significant.
- The model explains about 70% of between-school math variance and 6% of within-school variance, for about 17% of total math variance—not 70% of all math-score variance.
45:42
Hybrid Random Slopes Separate Within- and Between-School Effects
- To test whether the discounted-lunch math gap varies by school, Hoffman adds random slopes rather than assuming the student-level effect is constant.
- She keeps the original lunch contrasts for fixed effects but uses cluster-mean-centered versions for random slopes, avoiding another form of within/between smooshing.
- This hybrid specification allows the fixed effect to describe the overall contrast while estimating school-to-school variation specifically in the within-school relationship.
49:53
Testing Lunch-Status Random Slopes Across Schools
- Likelihood-ratio tests compare models dropping either random slope or both; the paid-versus-discounted slope varies significantly, while the reduced-versus-free slope does not.
- Dropping both slopes tests five covariance parameters: two slope variances and three covariances.
- The average paid-versus-discounted math gap is about 7.7 points, but the estimated gap can range from nearly zero to about 14 points across schools.
54:39
Cross-Level Interactions: Does School Composition Change the Gap?
- Hoffman adds interactions between school lunch composition and the paid-versus-discounted student contrast to test whether the student-level gap depends on the school.
- She does not add a corresponding interaction for reduced versus free because that contrast showed no significant random-slope variation across schools.
- An interaction using an uncentered student predictor initially combines moderation of within-school and between-school effects, producing a smooshed cross-level interaction.
1:00:00
Unsmooshing Cross-Level Interactions with Quadratic Terms
- To separate within- and between-school moderation, Hoffman adds the cluster-mean analog of each level-one interaction.
- When the school-level moderator is the same variable’s cluster mean, the required term is a quadratic of that school mean; in R, the quadratic is written with I(variable^2).
- The added terms distinguish moderation of student contrasts from moderation of contextual effects and make the cross-level interaction interpretable without assuming both patterns are identical.
1:04:59
Interpreting the Final Lunch-Composition Interactions
- At the reference composition of 30% discounted-lunch students, students receiving discounted lunch score about 8 points below paid-lunch classmates.
- A positive interaction makes that negative student-level gap weaker as the school’s discounted-lunch share increases: the gap is less severe in schools with more students receiving discounted lunch.
- The school-level reduced-versus-free moderation is not significant; a quadratic term indicates that the contextual association with discounted-lunch prevalence becomes more negative as prevalence rises.
1:10:45
Plots Confirm the Student and School-Level Patterns
- Hoffman’s plots vary school lunch composition in 10-percentage-point increments and show that schools with more reduced-price students tend to have lower predicted math means.
- The paid-to-reduced lines become less steep as discounted-lunch prevalence increases, while reduced-to-free lines remain parallel, matching the significant and nonsignificant interaction results.
- The final interpretation distinguishes student-level differences among paid, reduced, and free lunch groups from school-level composition effects, then transitions to Activity 5, a coding exercise preparing students for Homework 3.
Summary, takeaways, and chapters were generated by AI from the video's transcript and may contain errors. The video belongs to its creator, Lesa Hoffman.