CS 238 Week 7 Lecture
 Watch on YouTube →
Overview
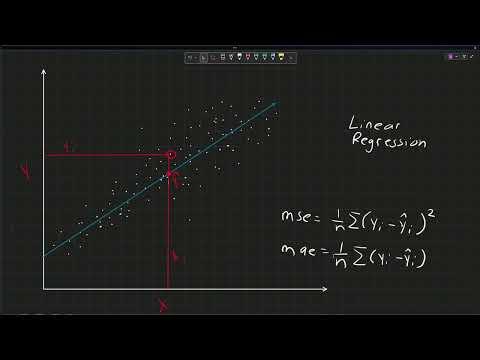
James Andro-Vasko introduces simple linear regression as a way to fit a line, y = mx + b, to paired data and use an independent variable—such as weekly study hours—to predict a dependent variable such as assignment scores. He explains how mean absolute error (MAE) and mean squared error (MSE) measure prediction errors, then demonstrates a Python workflow using scikit-learn, an 80/20 train-test split, and a plotted regression line; the example reports an MAE of about 3 and an R² near 0.70.
Key takeaways
- Simple linear regression fits y = mx + b to paired observations so an independent variable such as study hours can predict a dependent variable such as a student's score.
- MAE averages the absolute difference between observed and predicted values, whereas MSE squares residuals and therefore gives larger errors greater influence.
- An 80/20 train-test split lets the model learn its line from one subset and evaluate predictions on observations it did not train on.
- In the study-hours example, the reported MAE is about 3 score points and R² is approximately 0.70, suggesting a useful but imperfect relationship.
- For the assignment, compare candidate independent variables using plots, R², MAE, and MSE rather than relying on a single metric.
- Adding multiple predictors can improve a regression model, but it makes visualization more difficult than the one-predictor, two-dimensional example.
Chapters
0:00
Linear Regression Predicts Scores from Study Hours
- Treat study hours as the independent variable x and assignment scores from 0 to 100 as the dependent variable y.
- Fit a line described by y = mx + b to capture the relationship between observed data points.
- Use the fitted line to predict scores for future students, while recognizing prediction quality depends on the amount and quality of the data.
6:47
MAE, MSE, and the Python Training Workflow
- For each data point, compare its observed yᵢ with the line's predicted value ŷᵢ; MAE averages absolute residuals, while MSE averages squared residuals and penalizes large errors more.
- The Python example uses NumPy, pandas, Matplotlib, and scikit-learn to load study-hour and score columns and build a regression model.
- Scikit-learn's train_test_split reserves 80% of observations for training and 20% for testing; the model predicts test scores for evaluation.
13:53
Evaluate the Test Plot and Choose Predictors
- The plotted training observations are blue, the held-out test observations are black, and the fitted line is generated from the training data.
- The example reports an R² of roughly 0.70 and an MAE of about 3 score points; the lecturer notes that outliers raise MSE.
- The assignment asks students to compare spreadsheet variables as predictors and explain their graphs, R² scores, MAE, and MSE.
- Multiple independent variables may improve prediction, but the resulting higher-dimensional model is harder to visualize with a simple two-dimensional plot.
Summary, takeaways, and chapters were generated by AI from the video's transcript and may contain errors. The video belongs to its creator, James Andro-Vasko.