ACCT 417 (Fall 2026) - Chapters 8 and 9 Lecture
 Watch on YouTube →
Overview
Michael Barnes explains audit sampling as a way to obtain reasonable—not absolute—assurance, distinguishing attribute sampling for yes/no control tests from variable sampling for monetary misstatements. He demonstrates how confidence level, tolerable and expected deviation rates, and sample results affect sample size and control conclusions, comparing attribute-sampling tables with IDEA and introducing monetary unit sampling.
Key takeaways
- For attribute sampling, auditors accept a control only when the estimated upper population deviation rate is below the tolerable deviation rate—not merely because the observed sample rate is low.
- Confidence and sampling risk are complements: 95% confidence means 5% sampling risk, and increasing confidence generally increases the required sample.
- The distance between expected and tolerable deviation rates drives attribute sample size: narrowing that gap increases testing, while widening it reduces testing.
- Large population size does not automatically require a proportionally large sample; IDEA’s example increased the sample only from 91 to 95 when the population grew from 1,000 to 500,000.
- IDEA can provide more precise conclusions than lookup tables: with zero deviations in 76 items, its 2.98% upper rate falls just under a 3% tolerance, allowing the control to pass.
- For variable sampling, projected misstatement is compared with tolerable misstatement: projected error below the threshold supports fair presentation, while error above it does not.
Chapters
0:00
Course Announcements and Sampling’s Role on the CPA Exam
- Michael Barnes announces an alumni career coffee chat next Tuesday from noon to 1:00 in the Kirk Building; students should register through Handshake.
- Students can still request group placements and should check their grades for missing or incorrect points.
- Sampling remains relevant to the CPA exam, although data analytics tools such as IDEA let auditors examine entire datasets and may reduce reliance on samples.
2:19
Reasonable Assurance, Sampling Risk, and Representativeness
- Auditors cannot practically achieve 100% assurance for large organizations, so audits use reasonable assurance and retain some audit risk.
- Sampling risk arises when a tested sample is not representative of its population, potentially leading to an incorrect audit conclusion.
- Sampling errors can include Type I conclusions that identify a problem where none exists and Type II conclusions that miss a real problem; auditors are especially concerned with Type II errors.
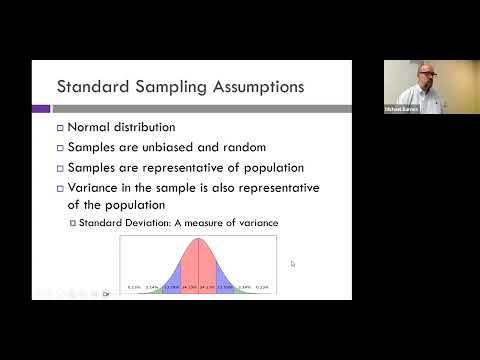
- Sound statistical samples are expected to be random and unbiased, with sample variability reflecting the population.
9:23
Attribute Sampling for Controls vs. Variable Sampling for Balances
- Attribute sampling answers a yes-or-no question, such as whether a control operated effectively or a deviation occurred.
- Variable sampling estimates monetary differences across a population using approaches such as monetary unit sampling or classical variables sampling.
- Tests of controls typically use attribute sampling, while tests of account balances commonly use variable sampling.
11:48
Confidence Levels and Deviation-Rate Inputs Determine Sample Size
- Confidence level equals 100% minus sampling risk: 95% confidence corresponds to 5% sampling risk, and 99% confidence to 1%.
- Higher confidence levels generally require larger samples.
- The tolerable deviation rate must exceed the expected population deviation rate; as the gap between them narrows, the required sample grows.
- Population size has limited influence once populations are large: increasing a population from 1,000 to 100,000 or more may change sample size very little.
16:28
Using Attribute-Sampling Tables to Select Control Samples
- For a 95% confidence level, a 6% tolerable deviation rate and 2% expected rate produce a sample size of 127, with up to 3 deviations acceptable.
- Raising the tolerable rate to 7% while keeping the expected rate at 2% lowers the table-based sample size to 88.
- A 90% confidence level requires the 90% table rather than the 95% table; table entries also indicate the maximum acceptable deviations.
20:27
Upper Deviation Rates Turn Sample Findings into Control Conclusions
- The sample deviation rate is the number of observed deviations divided by sample size; for example, 4 deviations in 127 items is about 3.1%.
- The upper deviation rate adds an allowance for sampling risk to the observed rate, estimating how high the population deviation rate could plausibly be.
- A control is supported as effective when its upper deviation rate is below the tolerable rate; if it exceeds the tolerable rate, the sample does not support effectiveness.
- Barnes’s table examples reject a control with 4 deviations in 127 items against a 6% tolerance and one with 2 deviations in 88 items against a 7% tolerance.
28:36
Variable Sampling: Tolerable and Projected Misstatements
- Tolerable misstatement is the maximum error acceptable in an account or disclosure; a lower threshold generally requires a larger sample.
- Projected misstatement estimates the population error based on errors identified in the sample; a simple illustration scales a $1,000 error in a 10% sample to roughly $10,000.
- If projected misstatement is below tolerable misstatement, the account may be accepted as fairly stated; if it exceeds the threshold, it is not supported as fairly stated.
32:06
IDEA Attribute Sampling: Sample Size and Control Evaluation
- IDEA calculates a sample size of 91 for a population of 1,000, 95% confidence, an 8% tolerable deviation rate, and a 3% expected rate.
- Reducing confidence from 95% to 90% lowers that sample to 63; increasing the population from 1,000 to 500,000 raises it only to 95.
- Narrowing the gap between expected and tolerable deviation rates increases sample size: changing the expected rate from 3% to 4% raises it to 123.
- For 52 vouchers at 90% confidence and a 7.5% tolerance, IDEA reports upper deviation rates of 9.7% for 2 deviations, 7.1% for 1, and 4.2% for 0; only the latter two support the control.
44:18
IDEA Precision and Monetary Unit Sampling Assumptions
- IDEA estimates an upper deviation rate of 7.06% for 4 deviations in a 127-item sample, supporting rejection against a 6% tolerable rate.
- For 0 deviations in 76 items at 90% confidence, IDEA gives a more precise 2.98% upper rate, just below the 3% tolerance and therefore supporting the control.
- The monetary unit sampling example uses a $900,000 tolerable error and a 75% confidence level to produce 20 selections at a $642,962.36 sampling interval.
- Barnes notes that 75% confidence would be unusually low in practice; the assignment uses it to keep the sample and student workload smaller.
Summary, takeaways, and chapters were generated by AI from the video's transcript and may contain errors. The video belongs to its creator, Michael Barnes.