02 - InvertR - Assignment II - Example in R
 Watch on YouTube →
Overview
Alex Smith walks through an R workflow for analyzing ecological communities, using river macroinvertebrate data as a practice dataset before students apply the methods to deep-sea hydrothermal vent invertebrates. The workflow covers Equal Earth mapping, alpha diversity, Bray–Curtis dissimilarity and NMDS, environmental vectors, ANOSIM and PERMANOVA tests, and decomposition of beta diversity into turnover and nestedness; students then use their results to prepare a three-minute presentation.
Key takeaways
- The assignment's two-file data structure separates a site-by-taxon presence–absence matrix from site metadata such as latitude, longitude, water chemistry, and physical measurements.
- Species counts provide a straightforward alpha-diversity measure: compare sites or rivers with boxplots, use ANOVA for an overall test, and Tukey's test for pairwise differences.
- NMDS represents between-site community dissimilarity in a reduced space; a Shepard plot and stress value help assess how faithfully the ordination captures the original distances.
- Fitted environmental vectors help interpret NMDS patterns by showing which measured variables are associated with the ordination axes and site positions.
- ANOSIM and PERMANOVA provide tests of group-level community differences, while beta-diversity decomposition distinguishes spatial turnover from nestedness.
- The river macroinvertebrate example is intended to teach transferable analysis steps that students can reuse on hydrothermal vent communities and other ecological datasets.
Chapters
0:00
Assignment Goals, Reusable R Code, and Equal Earth Mapping
- The assignment applies ecological community analyses to deep-sea hydrothermal vent invertebrates, while the walkthrough uses separate aquatic macroinvertebrate data.
- The GitHub repository contains annotated code; download it with Code → Download ZIP, unzip it, and place it in the R working directory.
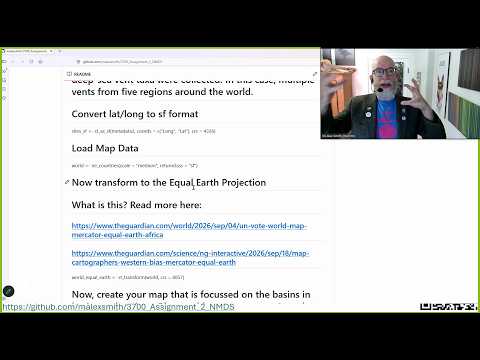
- The Equal Earth projection offers an alternative to familiar world maps that distort the relative area of regions.
4:00
Using River Macroinvertebrate Data as an Ecological Toolkit
- The practice dataset includes Welsh, Austrian, and North American river macroinvertebrates, including environmental DNA metabarcoding data.
- Smith frames the R code as a reusable toolkit that can be adapted to other habitats and organisms, including the hydrothermal vent assignment.
- For R errors, search for existing solutions first; if asking for help, include a screenshot showing the source, environment, console, and plot panes.
8:00
Load Presence–Absence Matrices and Map Sites in R
- The analysis loads two CSV files: a presence–absence matrix with sites as rows and taxa as columns, and metadata with coordinates and environmental measurements.
- The sf package supports spatial mapping; coordinate limits zoom the world map to the European rivers and nearby sampling region.
- The vegan package calculates site-level species counts as an alpha-diversity measure.
15:04
Compare Alpha Diversity and Model Community Differences with NMDS
- Boxplots compare species richness across rivers; ANOVA tests for overall differences and Tukey's post-hoc test identifies differing river pairs.
- Bray–Curtis dissimilarities feed a non-metric multidimensional scaling (NMDS) analysis to visualize community composition across sites.
- A Shepard plot and the NMDS stress value assess how well the two-dimensional ordination represents the original dissimilarities.
- Environmental vectors fitted to the ordination indicate associations with axes, including conductivity and variables such as distance from the lake, pH, and temperature.
21:30
Test Beta Diversity, Separate Turnover from Nestedness, and Present Results
- ANOSIM and PERMANOVA test whether community composition differs among river groups using dissimilarities; both support differences in the example data.
- The beta-part analysis uses a Jaccard-based decomposition to report turnover, nestedness, and total beta diversity; the example shows a small nestedness component.
- Students should export a PDF of their plots, interpret their own hydrothermal vent data, and upload a YouTube link to a presentation of three minutes or less.
Summary, takeaways, and chapters were generated by AI from the video's transcript and may contain errors. The video belongs to its creator, Alex Smith.